
Can consistent analyzer readings prove representative preparation?
No. Consistency within a biased portion does not demonstrate that the original material was represented. Sampling and preparation require separate consideration.
Carbon, nitrogen and protein are among the most important parameters in food and feed analysis. Standards demand reproducible, traceable results and modern elemental analyzers deliver these with high precision. What is often underestimated, however, is that the quality of the analytical result is already determined before the first measurement step. It depends significantly on how the sample was comminuted and homogenized.
Food matrices are inherently inhomogeneous. Too coarsely ground samples result in inhomogeneous subsamples, in which individual measurements deviate considerably from one another and reproducibility cannot be guaranteed. Too fine or too prolonged grinding, on the other hand, introduces heat that drives moisture out of the sample and dries it. As a result, protein values appear to increase, even though the actual composition has not changed.
Eltra GmbH
The moisture content of a sample is not a secondary parameter in this context, but the decisive quality indicator of sample preparation. Only the combination of elemental analysis (C/N or protein by the Dumas combustion method) and thermogravimetric determination of moisture allows a complete assessment of whether a measured result is analytically valid or represents an artefact of sample preparation.
This report summarizes the results of an experimental study in which five representative food matrices were analysed under different grinding conditions. The data were collected jointly by Retsch and ELTRA to demonstrate how strongly sample preparation influences the analytical result and how reliably the combination of grinding and subsequent analysis of nitrogen and moisture reveal these influences.
Methodological approach
Food samples must be processed fresh, so care was taken throughout the process to ensure that grinding and the subsequent determination of nitrogen took place directly in sequence. This minimizes the influence of, for example, moisture loss or gain through drying or absorption of water.
Each matrix was therefore processed fresh and prepared under at least two grinding conditions: an optimal setting as well as one or two problematic variants in which the sample was processed too coarsely, too finely or for too long.
The Dumas combustion method was used for the subsequent elemental analysis. The food sample is combusted at high temperatures, and nitrogen compounds in the combustion gas were measured. The protein value of the sample is calculated based on the nitrogen content using a protein factor (e.g. 6.25 for most foods or 5.70 for oilseeds and grains). Moisture was determined by thermogravimetric analysis, in which the mass loss of a sample as a function of temperature was measured.
Ten replicate measurements were performed for each condition. The standard deviation (SD, shown as error bars in the figures) was calculated as a measure of variation to compare the spread within the sample, and the relative standard deviation (RSD in %) was used to compare degrees of grinding. An RSD value below 2 % is considered analytically acceptable.
RESULTS
Sunflower seeds
Sunflower seeds were ground both optimally and deliberately too coarsely. For optimal comminution, 200 g of the oily sample was slowly ground using a 4 mm ring sieve at 18,000 rpm in the Ultra Centrifugal Mill ZM 300. A similar quantity was prepared using a few very short pulses at 10,000 rpm with the Knife Mill GM 200, as the ZM 300 produced samples that were too homogeneous even when using 6 or 8 mm sieves (Fig. 1a).
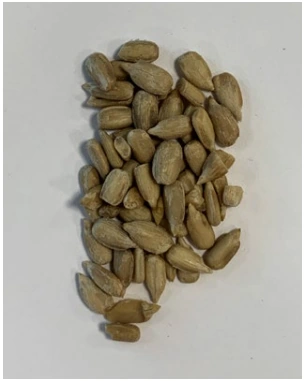
Fig. 1a: Sunflower seeds: original sample (left), optimally ground using a ZM 300 with a 4 mm ring sieve (center), and ground too coarsely using a GM 200 (right).
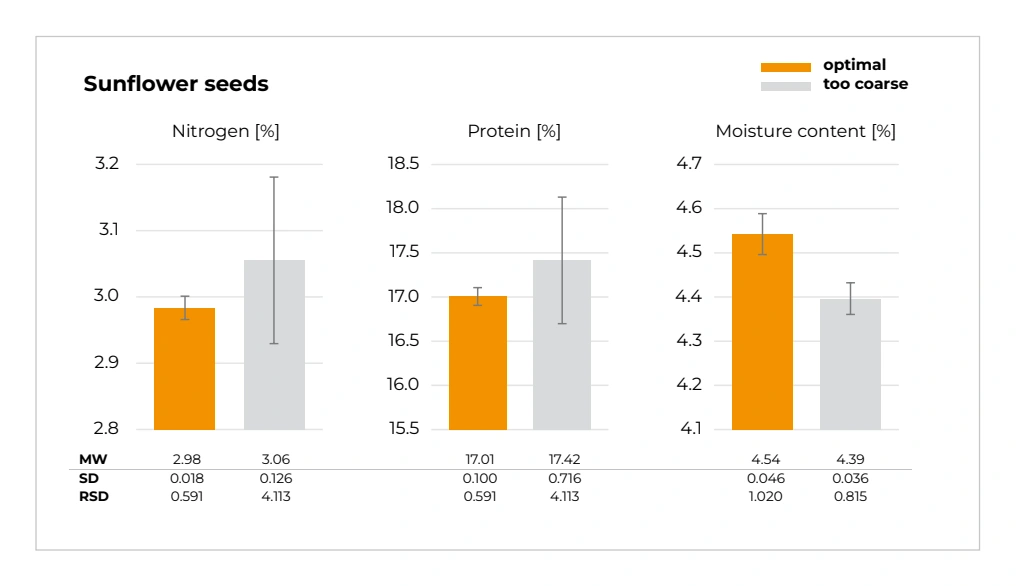
Looking at the standard deviation of the nitrogen values, it is clearly shown that the variation of the sample with optimal grinding is significantly lower (SD 0.018 %) compared to the too coarsely ground sample (SD 0.126 %b). Comparing the grinding degrees, the RSD for nitrogen and protein respectively is 0.591 % with optimal grinding, which is within the acceptable range. Too coarse grinding increases the variability by a factor of seven to a RSD of 4.113 %: the subsamples are inhomogeneous, and each weighing captures a different composition.
Moisture remains similar, at around 4.54 % with optimal grinding and 4.39 % with too coarse grinding. The slightly higher proportion of moisture loss in the optimal sample can be explained by the greater degree of size reduction: moisture can escape more easily from smaller particles than from seed pieces or whole seeds.
Sunflower seeds
Nitrogen [%]
Protein [%]
Moisture content [%]
WHEAT
The wheat grains were deliberately ground both optimally and too finely. For the optimal grinding, a 1.5 mm ring sieve (ZM 300) was used, whereas a 0.2 mm ring sieve was used for grinding that was too fine. During fine grinding, temperatures elevated to 50 - 60 °C.
Fig. 1b: Nitrogen, protein and moisture content of sunflower seeds. Mean ± SD. Optimal (ZM 300 4 mm) vs. too coarse grinding (GM 200). RSD increases by a factor of seven for too coarse grinding.
Fig. 2a: Wheat: original sample (left), ground optimally (middle, ZM 300 1.5 mm) and over-ground (right, ZM 300 0.2 mm).
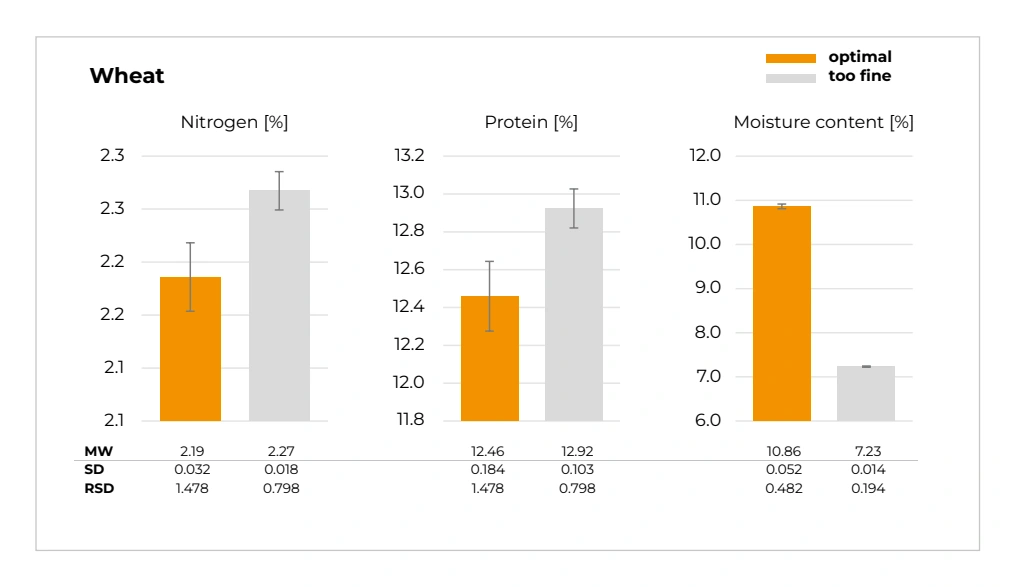
Looking at the nitrogen values with optimal grinding, a low variation is evident (SD 0.032 %, RSD 1.478 %). With too fine grinding degree, an even lower variation and thus apparently better reproducibility is observed (SD 0.018 %, RSD 0.798 %), but at the same time higher nitrogen values (Fig. 2b). Why is this? Finer powder is more homogeneous, so the individual measurements agree more closely.
The decisive finding, however, lies in the moisture content, which drops from 10.86 % to 7.23 % when comparing optimal with too fine grinding. A loss of 3.6 percentage points due to heat input during over-grinding. This moisture loss has a direct consequence: the nitrogen content appears to increase because the ratio of nitrogen to total mass shifts.
The lower RSD obtained with too fine grinding conceals the fact that the measured result no longer represents the original sample. Precision and trueness become decoupled.
Wheat
Nitrogen [%]
Protein [%]
Moisture content [%]
Mixed nuts
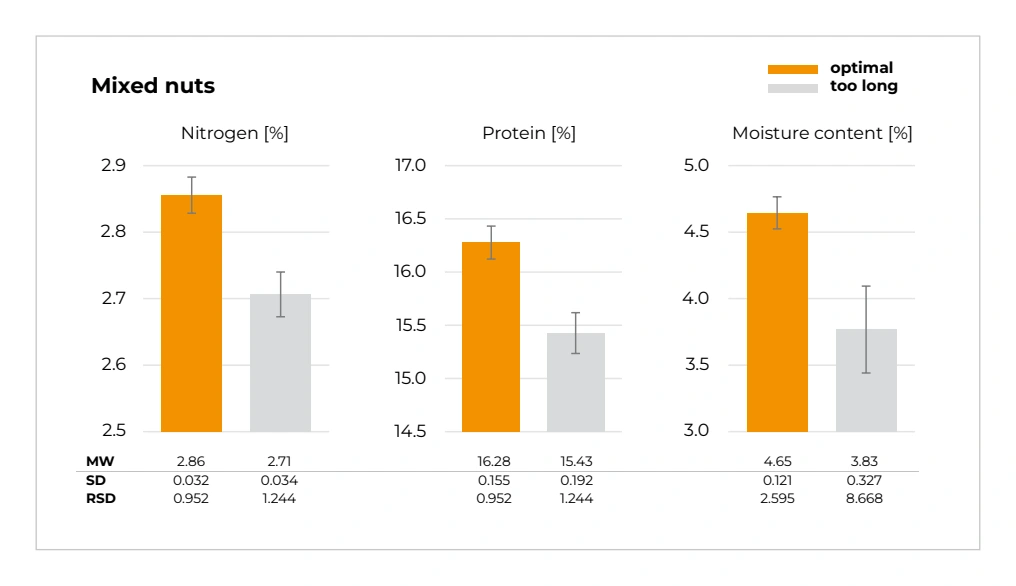
A commercial mixed nut product was also ground optimally and for too long / over-ground and subsequently analysed. The optimal grinding degree was achieved using the GM 200 with a few pulses at 4,000 rpm in reverse mode, followed by 10 s at 10,000 rpm in forward mode. The GM 200 was also used for over-grinding, and in addition to the optimal procedure, the sample was ground for too long: a total of 1 min at 10,000 rpm in forward mode (a).
Fig. 2b: Nitrogen, protein and moisture content of wheat grains. Mean ± SD. Optimal (ZM 300 1.5 mm) vs. too fine grinding (ZM 300 0.2 mm, temperature 50 - 60 °C). Despite better RSD, the moisture loss of 3.6 % is a clear indication of an altered sample due to sample preparation.
Fig. 3a: Mixed nuts: original sample (left), ground optimally (middle, GM 200) and over-ground (right, GM 200).
Comparing the variance of nitrogen values between optimal grinding and over-grinding, there is hardly any difference (SD 0.027 % vs. 0.034 %). However, the RSD shows that the variance of the measured values is lower with optimal grinding compared to the overground sample (RSD 0.952 % vs. 1.244 %).
This means that there are greater fluctuations in the measured nitrogen values for the overground sample, as the sample is not homogeneous. Interestingly, the determined nitrogen content of the over-ground sample with 2.71 % is lower than the measured value of the optimally prepared sample with 2.86% (b).
Mixed nuts
Nitrogen [%]
Protein [%]
Moisture content [%]
The moisture content provides insight here: the over-ground sample shows with 3.83 % a lower moisture content than the optimal sample with a value of 4.65 %. Due to the longer and warmer grinding process, more water and fat are released from the mixed nut sample, meaning the apparently valid measured values do not reflect reality. Why the loss of fat is decisive here: it contains proteins. Therefore, the protein content appears lower in the overground sample despite the measured moisture loss. The additional clumping that accompanies over-grinding produces a highly inhomogeneous sample, as confirmed by the SD and RSD values.
Pumpkin seeds
Pumpkin seeds are characterised by a particularly high protein content of around 30 to 36 % and therefore represent an interesting sample material for nitrogen/protein analysis. For the analysis, pumpkin seeds were prepared at an optimal grinding degree and an overground, too prolonged grinding degree. The procedure corresponds to the grinding of the mixed nut sample using the GM 200.
Fig. 3b: Nitrogen, protein and moisture content of mixed nuts. Mean ± SD. Optimal grinding vs. over-grinding (GM 200). RSD increases with over-grinding.
Fig. 4a: Pumpkin seeds: original sample (left), ground optimally (middle, GM 200) and over-ground (right, GM 200).
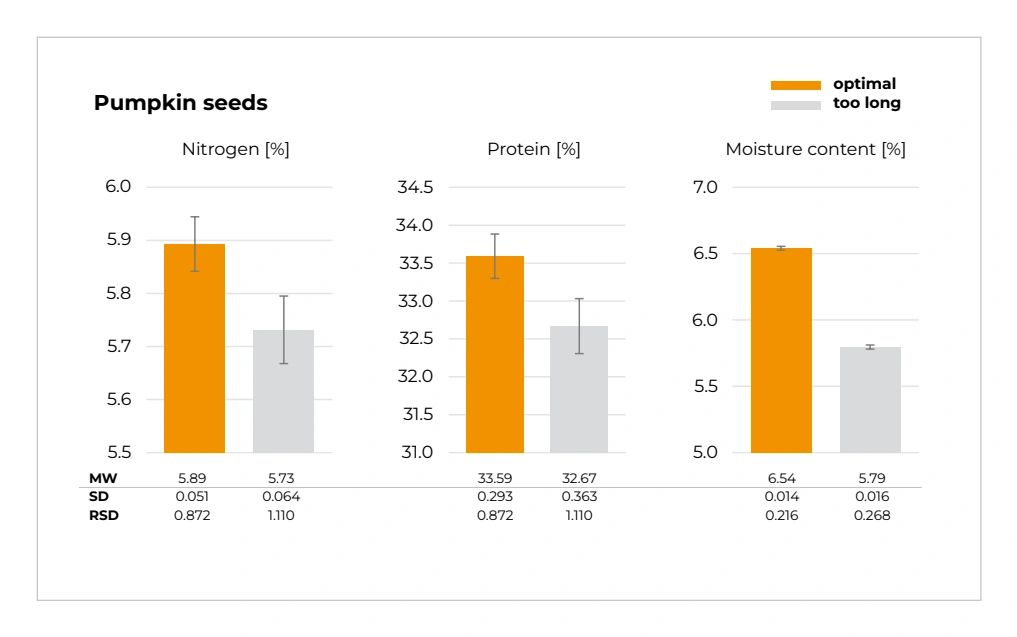
Fig. 4b: Nitrogen, protein and moisture content of pumpkin seeds. Mean ± SD. Optimal grinding vs. over-grinding (GM 200). RSD increases with over-grinding.
The pumpkin seed sample shows a low variation with optimal grinding (SD 0.051 %, RSD 0.872 %). The over-ground sample, on the other hand, shows a higher variation (SD 0.064 %, RSD 1.110 %) with simultaneously lower nitrogen values (b). Moisture content decreases slightly with over-grinding from 6.54 % to 5.80 %, indicating a small but measurable heat input. The pumpkin seed results are similarly to those for the sunflower seeds. Over-grinding resulted in the loss of both moisture and fat. As a result, proteins are lost and distributed differently within the clumped sample, producing inconsistent and unrealistic results.
Pumpkin seeds
Nitrogen [%]
Protein [%]
Moisture content [%]
MEAT
Meat represents an analytically demanding matrix due to its high-water content of 42 - 46 %. Three grinding conditions were compared: optimal, too coarse and too long. All grindings were carried out using the GM 200: a few pulses for too coarse, an additional 10 s at 10,000 rpm for optimal, and a further 20 s at 10,000 rpm for too long.
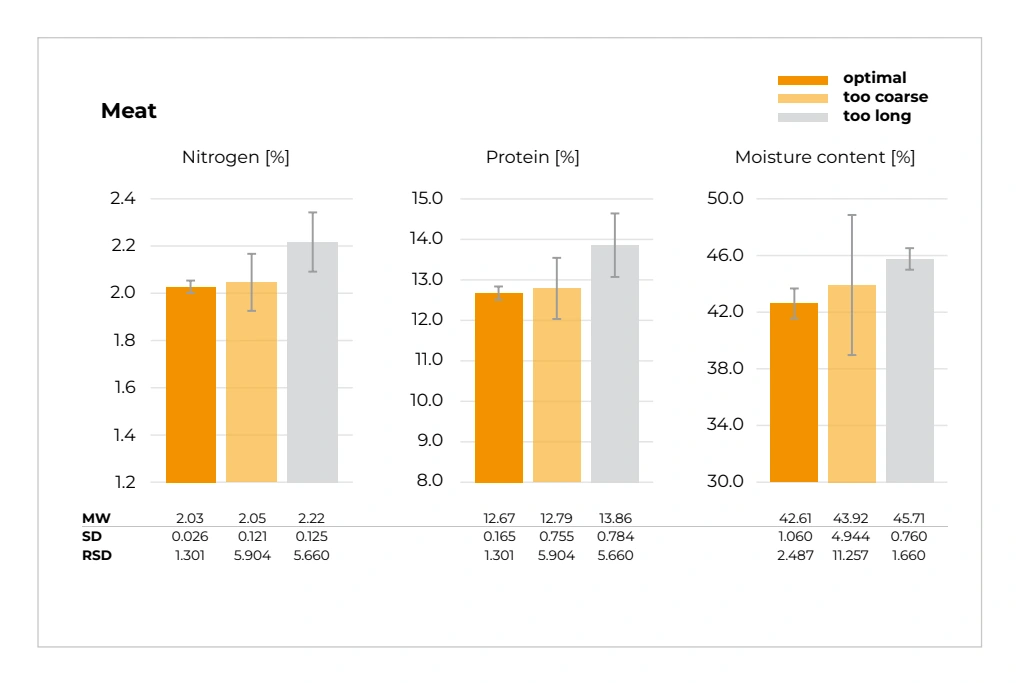
The nitrogen values clearly show that only the optimal settings deliver reproducible results (SD 0.026 %, RSD 1.301 %). The average moisture content of 42.612 % also confirms these results with very consistent measured values (SD 1.060 %, RSD 2.487 %; Fig. 5b). The RSD for moisture is just above the 2 % threshold, indicating the difficulty of reproducibly grinding and subsequently analysing moist samples with a high connective tissue content.
Fig. 5a: Meat with pork belly before grinding (top left) and at the three grinding levels too coarse, optimal and too long (top right, bottom left, bottom right; all with GM 200). The discoloration and separation effects in the too-long ground sample are clearly visible.
Fig. 5b: Nitrogen, protein and moisture content of meat. Mean ± SD. Optimal grinding degree, too coarse grinding degree and too long ground sample (GM 200). SD and RSD increase with too coarse and too long grinding of the sample; only optimal grinding delivers reproducible results for all parameters.
In general, both too coarse and too prolonged grinding show a markedly higher variability in the measured nitrogen values (RSD 5.904 % and 5.660 %).
With too coarse grinding of the meat sample, similar nitrogen values are observed as with optimal grinding, but a much higher variation for the nitrogen (SD 5.904 %) and moisture (SD 4.944 %) content, since the sample is not homogeneous (Fig. 5b).
Nitrogen [%]
Protein [%]
Moisture content [%]
optimal too coarse too long
Meat
In contrast, too prolonged grinding resulted in higher nitrogen values (2.22 % for too long vs. 2.03 %), which can be explained by the greater water and fat loss during longer and therefore warmer grinding. Excessive grinding caused the sample to separate significantly and partly liquefy, which explains the fluctuations and the apparently higher protein content of the sample. The higher moisture values can be attributed to the fact that the higher degree of grinding allows water to escape more readily during analysis.
These results indicate that meat allows no compromise in sample preparation: neither too coarse nor too long grinding yields an analytically valid result.
Discussion and conclusion
The results across all five matrices are consistent, the grinding degree is not a technical secondary condition, but an analytical variable. Too coarse grinding produces inhomogeneous samples with high measurement uncertainty, without this being visible at the analyzer itself. The measurements appear precise but do not represent the actual composition of the overall sample. Too fine or too prolonged grinding measurably alters the sample through heat input, moisture and volatile compounds escape, and nitrogen and protein values appear to increase. Alternatively, separation effects occur in which water and/or fats are separated out, causing the nitrogen/protein values to appear to decrease.
Moisture content proves to be an indispensable quality indicator in this context. A stable moisture content is not a coincidental finding, but evidence of thermally gentle and fully homogenizing sample preparation. For certain food samples, only a combined evaluation of elemental analysis and the determination of moisture can reveal whether a result is analytically valid or represents an artefact of sample preparation. The combination of both analytical methods should be incorporated into this cross-check as part of routine laboratory practice.
For laboratory practice in food sample analysis, a clear recommendation emerges: The validation of analytical methods should include sample preparation, as required by current standards. The optimal grinding setting is matrix-specific and must be determined individually for each sample. The data presented here demonstrates that apparently minor deviations from the optimal setting can make the difference between a valid and a misleading analytical result.
RELIABLE PROTEIN DETERMINATION BEGINS WITH THE RIGHT SAMPLE PREPARATION, BEFORE THE SAMPLE REACHES THE ANALYZER.
GRINDOMIX GM 200 – knife mill for food and feed
The GRINDOMIX GM 200 Knife Mill from Retsch is specially designed for the fast and gentle homogenisation of food, feed and similar matrices – including samples with a high water, fat or oil content. The powerful 1,000 W motor with variable speed enables the processing of sample quantities up to 700 ml. Numerous accessories such as gravity lids allow optimal adaptation to different sample matrices.
The reverse mode protects the sharp blades and pre-grinds samples using the blunt sides of the blades. Programming options such as grinding duration, speed or interval function complete the flexible range of applications.
Ultra centrifugal mill ZM 300 – fast, precise, analysis-neutral
The Ultra Centrifugal Mill ZM 300 from Retsch achieves the highest throughput in its class with speeds up to 23,000 rpm and enables analysisneutral sample preparation in the shortest possible time.
The integrated temperature monitoring ensures reproducibility even during long grinding processes or with large sample volumes. The wide selection of rotors (6, 12 or 24 teeth), ring sieves and cassettes makes the ZM 300 a versatile instrument for grains, seeds, food, feed, plant materials and many other matrices.
our solutions.
ELEMENTRAC CN-r – C/N/PROTEIN ANALYZER ACCORDING TO DUMAS
The ELEMENTRAC CN-r from ELTRA is a combustion analyzer based on the Dumas method for the simultaneous determination of carbon and nitrogen in organic and inorganic samples. The analysis is completed within 2 minutes and 30 seconds, making it the fastest on the market. Complete oxidation of the sample in an excess of oxygen at 950 °C releases combustion gases, which are subsequently detected by infrared detection and thermal conductivity.
This detection principle enables precise and selective analysis over a wide concentration range. The analysis complies with current standards and norms (ISO, AOAC, etc.).
Tga – thermogravimetric analyzer
The TGA from ELTRA determines mass changes of a sample as a function of temperature and time. The sample is heated under defined conditions, whereby the mass loss due to moisture and volatile components, as well as the ash content, is determined precisely. The method is characterized by high reproducibility and direct measurement without calibration.
In combination with elemental analysis, the TGA provides
important supplementary
information,
particularly for interpreting changes in carbon and nitrogen contents due to different degrees of homogenization.
our solutions.
Plan the configuration for your material.
Define the test basis and preparation route together. Consider the ingredients, moisture condition and amount submitted to analysis. Comparing repeat portions from a prepared sample can help assess consistency, but the laboratory also needs to connect that sample to the material originally collected.
| Consideration | Information to provide |
|---|---|
| Measurement basis | Required analytical method |
| Sample matrix | Ingredients and moisture |
| Repeat portions | Preparation consistency and traceability |
How should the application examples be used?
The results describe the materials and configurations discussed here. Confirm equipment options, contact materials and operating conditions for your own sample before adopting a method. A demonstrated endpoint does not guarantee the same outcome for a different material.
Discuss material testing with Glen Mills or request further information or a quote.