

Can results from different sieving methods be compared directly?
Only after establishing what each procedure measures for that material. Method, sample condition and endpoint can all influence the retained fractions.
Mike Lucka
The solubility of drugs, the taste of chocolate or the solidity of concrete – these are only a few examples of physical or chemical material properties which are influenced by particle size. Hence, the determination and knowledge of the particle size distribution is an essential part of the quality control process for industrial products. From incoming and production control to research and development sieve analyses are used to determine a number of parameters or simply the particle size. Easy handling, low investment cost and high accuracy make sieve analysis one of the most frequently used procedures for measuring the particle size. this discussion gives an overview of the different sieving techniques and describes the necessary steps to ensure reliable results.
Sieving is carried out to separate a sample according to its particle sizes by submitting it to mechanical force. The direction, intensity and type of force depends on the chosen sieving method. The sample is either moved in horizontal or vertical direction. In tap sieve shakers both movements are superimposed. Air jet sieving is a special case, here the sample is dispersed by an air jet blown out of a rotating nozzle.
Which factors need to be established to select a suitable sieving method?
- Particle size
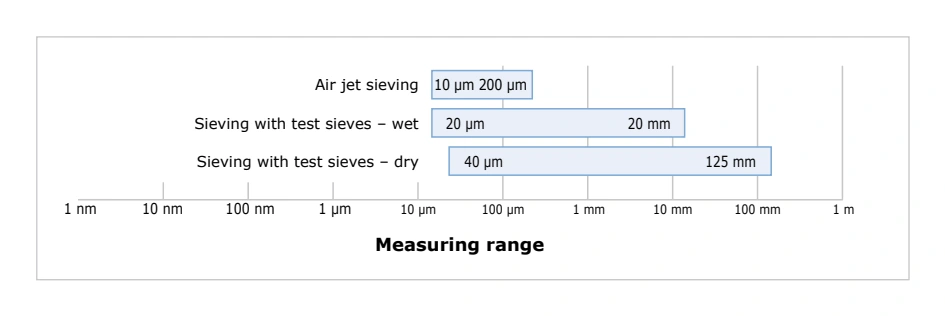
If the required measuring range lies between approximately 40 microns and 125 mm, classical dry sieving is the method of choice. The range may be extended to 20 microns by wet sieving and to 10 microns by air jet sieving .
Measuring range of air jet, wet and dry sieving
Measuring range
- Sample properties
It should be taken into account whether the particles form agglomerates, which density the material has or if it tends to be electrostatically charged.
- Standards
Sieving methods are described in the DIN standard 66165. If industry-specific test procedures or standards exist these also determine the choice of method.
- Number of fractions
Are several fractions required? Or is it sufficient to know which percentage of the sample is smaller or bigger than a defined particle size? The method for obtaining the latter information is called a sieve cut because the sample is simply separated into two fractions.
Different Sieving Methods
Once these questions are satisfactorily answered, a suitable sieving method can be selected. this discussion describes the different sieving techniques.
Vibrational sieving : Vibrational sieving submits the sample to three dimensional movements. A vertical throwing motion is superimposed by a circular movement. This mechanism causes the particles to be evenly distributed over the entire sieving surface and to be thrown into the air where they ideally change their orientation in a way that allows them to be compared to the sieve apertures in all possible dimensions. Vibratory sieve shakers like the AS 200 series , AS 300 control and AS 450 basic and control operate according to this principle. All RETSCH vibratory sieve shakers are suitable for dry as well as wet sieving. The “control” models can be calibrated and permit software-based evaluation of the sieving process. Moreover, they provide reproducible, globally comparable results thanks to sieving with controlled acceleration (see box on the left).
(left): Principle of vibratory sieving
(right): Vibratory sieve shakers of the AS 200 series
| Parameter | AS 200 basic | AS 200 digit cA | AS 200 control | AS 300 control | AS 450 basic | AS 450 control |
|---|---|---|---|---|---|---|
| Measuring range | 20 µm - 25 mm | 20 µm - 25 mm | 20 µm - 25 mm | 20 µm - 40 mm | 25 µm - 125 mm | 25 µm - 125 mm |
| Sieve diameter | 100 / 150 / 200 / 203 (8") mm | 100 / 150 / 200 / 203 (8") mm | 100 / 150 / 200 / 203 (8") mm | 100 / 150 / 200 / 203 (8") / 305 (12") / 315 mm | 400 / 450 mm | 400 / 450 mm |
| Amplitude in mm | 1 – 100 % | 0.2 – 3.0 | 0.2 – 3.0 | 0.2 - 2.2 | 0.2 - 2 | 0 – 2.2 |
| Maximum load | 3 kg | 3 kg | 3 kg | 6 kg | 15 kg | 25 kg |
| Recalibration and sieve acceleration | - | - | yes | Yes | - | yes |
A suitable vibratory sieve shaker for every requirement
Wet sieving: A special case of vibratory sieving is wet sieving. Agglomerates, electrostatic charging or a high degree of fineness can all make the sieving process difficult and in such cases wet sieving may be called for. This involves washing the sample through the sieve stack in a suitable medium which is usually water.
Horizontal sieving : Here the sample is subjected to a circular horizontal movement. This two-dimensional motion does not cause the particles to change their original orientation. This method is particularly suitable for longish, disk-shaped or fibrous samples (sieving with circular motion according to DIN 53 477). For this application RETSCH offers the AS 400 control with an electronically controlled speed of 50 to 300 rpm. Sieve diameters of 100 mm / 150 mm / 200 mm / 203 mm (8") / 305 (12") mm / 315 mm / 400 mm may be used to separate bulk samples of up to 15 kg in one run. The measuring range lies between 45 µm and 63 mm. This sieve shaker can be recalibrated and controlled with RETSCH’s evaluation software EasySieve®.
(left): Principle of horizontal sieving
(right): Horizontal sieve shaker AS 400 control
(left): Principle of tap sieving
(right): Tap sieve shaker AS 200 tap
(left): Principle of air jet sieving
(right): Air jet sieving machine AS 200 jet
Tap sieving : The use of tap sieve shakers is stipulated in a number of standards. In the tap sieving process, a circular horizontal movement is superimposed by a vertical tapping motion as, for example, in the AS 200 tap (speed 280 rpm, taps 150 per min). The AS 200 tap accepts up to 7 sieves with diameters of 200 mm or 203 mm (8”) and a maximum sample load of 3 kg. This sieve shaker can also be controlled with the evaluation software EasySieve®.
Air jet sieving : To obtain a sieve cut by air jet sieving only one sieve is used instead of a stack of sieves, and the sieve itself is not put into motion. An industrial vacuum cleaner generates low pressure inside the sieve chamber. The sucked-in air escapes with high speed from the rotating slit nozzle below the sieve and disperses the particles which can then be compared to the sieve apertures. When the particles hit the sieve lid they are not only redirected but also deagglomerated. The particles which are small enough are then transported through the sieve mesh and sucked in. It is also possible to collect them in a cyclone. RETSCH offers the AS 200 jet for air jet sieving . Features include the innovative Open Mesh Function to reduce the number of near-mesh particles and automatic vacuum regulation (accessory). Sieve diameters of 200 mm and 203 mm (8”) can be used with the AS 200 jet which covers a measuring range from 10 µm to 4 mm. The machine may be controlled with EasySieve® evaluation software.
Sieve Analysis Step by Step
A complete sieving process consists of the following steps which should be carried out precisely and carefully. a) Sampling b) Sample division (if required) c) Selection of suitable test sieves d) Selection of sieving parameters e) Actual sieve analysis f) Recovery of sample material g) Data evaluation h) Cleaning and drying the test sieves
a) Sampling JCorrect sampling is essential to obtain a representative laboratory sample, especially if the material is heterogeneous. Some important questions should be clarified in advance: • Which quantity is required to ensure representativeness of the original sample • From which part of the original material should the sample be taken Some industry-specific standards provide guidelines and directions on the correct sampling process, for example DIN 51701 in the coal industry. It contains, for example, the formula
G [kg] = 0.07 [kg/mm] x z [mm]
which indicates how much sample “G” must be extracted from a bulk sample with maximum particle size “z” to obtain a representative quantity. Taking a coal sample with a maximum particle size of 5 cm as an example, the following calculation applies: G [kg] = 0.07 kg/mm x 50 mm G = 3.5 kg Consequently, the extracted sample amount should be at least 3.5 kg to make sure it is representative. For other materials than coal a different density should be taken into account.
b) Sample division If a sample quantity is too large for analysis, it must be divided in a way that ensures the part sample represents the original material. Sampling may be carried out randomly or manually by coning and quartering. These methods, however, are errorprone and may cause standard deviations amounting to 10 % and more just by imprecise division (figure 10, C + D). Automated sample dividers like the PT 100 or PT 200 from RETSCH offer a much more exact and convenient method. In the PT 100 the sample flows through a feed hopper directly into the openings of a dividing head. Even if the sample is coarse-grained, the deviations among the quantities of each sample vessel are negligible. The division process runs fully automatically. The dividing head – which can have 6, 8 or 10 outlets – executes a controlled constant 11 rotations per minute, independent of load and power frequency. This means practically that the sample flow is divided 1100 times per minute when a dividing head with 10 outlets is used. Thus the highest possible degree of division accuracy is statistically guaranteed.
Rotating sample divider PT 100
A: Sample divider PT 100 B: Sample splitter C: Coning & quartering D: Random sampling
Standard deviations of analysis results resulting from different sampling methods
Standard deviation
c) Selection of suitable test sieves The selection of the sieves depends on the sample quantity and on the approximate particle size distribution. To cover the complete particle size range of the sample the increments of the mesh apertures should follow a logarithmic series. This is frequently done with the help of the Renard series, for example R10/3. The standard DIN 66165 contains some guidelines on the selection of sieve diameters and mesh sizes. It also stipulates the maximum sample load permitted for different mesh sizes and also the maximum particle size .
Correct loading of the sieves ensures reproducible results!
| Mesh size | Max. batch | Max. permitted sieve oversize |
|---|---|---|
| 25 µm | 14 cm3 | 7 cm3 |
| 45 µm | 20 cm3 | 10 cm3 |
| 63 µm | 26 cm3 | 13 cm3 |
| 125 µm | 38 cm3 | 19 cm3 |
| 250 µm | 58 cm3 | 29 cm3 |
| 500 µm | 88 cm3 | 44 cm3 |
| 1 mm | 126 cm3 | 63 cm3 |
| 2 mm | 220 cm3 | 110 cm3 |
| 4 mm | 346 cm3 | 173 cm3 |
| 8 mm | 566 cm3 | 283 cm3 |
Calculation of sieve load The oversize on a sieve with a mesh size of 1 mm, for example, should not be more than 20 cm3 per square decimeter. For a 200 mm sieve that equals 63 cm3 oversize, for a 400 mm sieve it is 252 cm3. The maximum batch should not exceed twice the amount of the oversize value, i.e. a 200 mm sieve with mesh size 1 mm should not be filled with more than 126 cm3 sample material. By multiplying these values with the bulk density, the corresponding masses can be obtained.
Examples for the maximum batch and permitted sieve oversize for 200 mm sieves (according to DIN 66165)
The maximum sieve oversize permitted on a sieve can be approximately calculated with the formula
with R being the maximum permitted sieve oversize in [g]. D stands for the sieve diameter (200 mm / 300 mm etc.), w is the mesh size in [mm] and p describes the material density. In the standard 66165 and in the above example a density of 1 kg/dm3 was assumed. The standard also describes the maximum load per sieve which should not exceed the maximum sieve oversize D by more than twice the amount. The maximum particle size permitted can be calculated by using this formula xmax = 10 x w0.7 with xmax [mm] being the maximum particle size permitted, and w describing the nominal mesh size of each sieve (the value is used in the formula without unit). For a sample on a sieve with an aperture size of 250 microns the following calculation is used to determine the maximum particle size permitted: xmax = 10 x w0.7 xmax = 10 x 0.2500.7 xmax = 3.79 (unit = mm)
Movement of particles in a vibratory sieve shaker in relation to the sieve bottom
d) Selecting suitable sieving parameters Usually, industry-specific standards or company-specific regulations contain information about the required sieving pa-rameters. Should this not be the case, those parameters need to be ascertained by experiment. The sieving time and, when using vibratory sieve shakers also the amplitude, are the most important factors. Observing the maximum sieve load helps protecting the sieve from damages and ensures that every particle has the possibility to compare with the sieve mesh as frequently as possible and in every dimension.
Amplitude:
During a sieving process there is a continuous size comparison between sieve apertures and particles. If a particle is smaller than an aperture, it passes the mesh. If it does not pass the aperture it is thrown upwards with the next lifting of the sieve bottom, takes a different orientation – which is important with longish particles – and hits the mesh again for a new comparison. Each comparison is an opportunity for the particle to pass the sieve mesh. Hence, the objective of a sieving process is to generate as many comparisons as possible in a given time. This is ideally the case when within the period of a sieve bottom vibration exactly one comparison takes place and the particles which don’t pass the sieve mesh are accelerated in a way that within the next period another comparison takes place. This state is called statistical reso-nance (blue curve in figure 13). If a particle is accelerated too strongly it has only very few occasions to compare with the sieve apertures (yellow curve) and the complete separation of the sample is delayed; if a particle is hardly acceler-ated or not at all, it cannot orientate freely for a new comparison (red curve). The acceleration rate of a particle depends on the set amplitude. The optimum amplitude for a particular material and quantity needs to be ascertained empirically. Amplitude here means the complete oscillation in the horizontal plane, below as well as above the idle position. An amplitude of 1.2 mm indicates a movement of + 0.6 mm and – 0.6 mm in relation to the idle position.
Particle
Sieve bottom
Blue curve: The particle is in statistical resonance with the sieve bottom; red curve: the particle is not sufficiently moved; yellow curve: the particle is thrown too high
Sieving time:
According to DIN 66165 the sieving process is considered as finished when, after one minute of sieving, less than 0.1% of the feed quantity passes the sieve. If the undersize is larger the sieving time needs to be extended. Experience has shown that vibratory sieving in 3 dimensions is particularly suitable for achieving a sharp separation of fractions in a very short time.
e) Carrying out the actual sieve analysis After selection of the parameters the actual sieving process starts. The following steps have to be carried out in chrono-logical order: 1. Put together a sieve stack with collecting pan 2. Select sieving aids, if required: for mesh sizes < 500 microns the use of cubes,
chains or brushes is recom-mended to facilitate passage of the sample
3. Determine the empty weight of sieves and collecting pan: This can be done software-based or manually by using a balance. Suitable programs such as EasySieve® make weighing and evaluation much easier. 4. Place the sieve stack with increasing mesh size on the collecting pan 5. Weigh the sample and put it on the top sieve (biggest mesh size); clamp sieve stack on the machine 6. Set the amplitude / speed and sieving time on the sieve shaker 7. Start the sieve shaker 8. When the sieving time has expired weigh each sieve and the collecting pan with the fraction on it 9. Determine the mass and percentage of each fraction 10. Evaluation
Stacking of sieves (example)
f) Recovery of sample When the sieving process is finished the material is removed from the sieves. The recovery of the fractions is a decisive advantage of sieve analysis over most optical measurement methods. The fractions are not only analytical values but physically exist and can be used for further processes following sieve analysis.
g) Determination and evaluation of data Data evaluation can be done manually or with the help of a software like EasySieve®. As shown in table 2 the percentages are calculated and displayed graphically .
| Sieve [µm] | Net weight [g] | Weight after sieving [g] | Difference [g] | Percentage p 3 [%] | Cumulative distribution Q [%] 3 |
|---|---|---|---|---|---|
| Pan | 501 | 505.5 | 4.5 | 3 | 3 |
| 45 | 253 | 259 | 6 | 4 | 7 |
| 63 | 268 | 283 | 15 | 10 | 17 |
| 125 | 298 | 328 | 30 | 20 | 37 |
| 250 | 325 | 373 | 48 | 32 | 69 |
| 500 | 362 | 384.5 | 22.5 | 15 | 84 |
| 1,000 | 386 | 401 | 15 | 10 | 94 |
| 2,000 | 406 | 412 | 6 | 4 | 98 |
| 4,000 | 425 | 428 | 3 | 2 | 100 |
| Total | = 150 g | = 100 % |
Tabelle 2: Example of a sieve analysis
The empty sieves are weighed before and, containing the respective fractions, after the sieving process. The difference corresponds to the weight of each fraction. If these are put into relation to the total weight of the sample the percentage of each fraction can be calculated. This method has the advantage that due to the absence of dimensions sieving is carried out independently of the density or mass of the sample material. The difference between weighed sample and sum of the single fractions is called sieve loss. If this is more than 1 % of the feed quantity DIN 66165 stipulates that the sieve analysis needs to be repeated. The mass percentages of the fractions can be graphically displayed as histograms . In the example the largest fractions can be found between 250 microns and 500 microns with 32 %. By adding up the single fractions and through interpolation between the measuring points the cumulative distribution curve Q3 is obtained .
This curve helps to determine a variety of sample properties. Taking a look, for example, at the particle size 250 microns the corresponding value of 36 % can be read off the y-axis. This means that 36 % of the total sample are smaller than 250 microns . To determine the median Q3 (50) of this distribution, the corresponding particle size (330 microns) is read off the x-axis. This means that 50 % of the sample mass are smaller than or equal 330 microns. In this way various x(Q3) or Q3(x) values can be determined.
A software like EasySieve® allows for quick and error-free evaluation of various parameters.
(left): Histogram with percentages of the fractions
(right): Histogram with cumulative distribution curve of the fractions
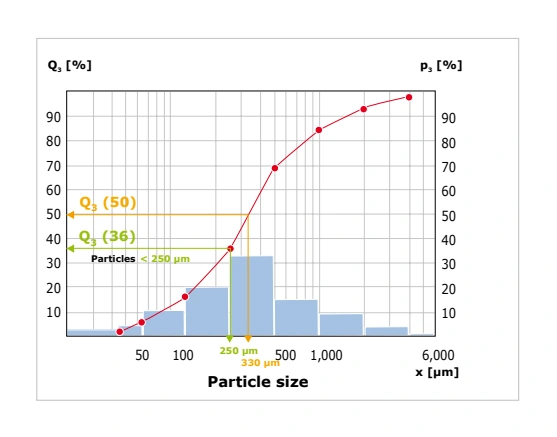
Cumulative distribution curve with exemplary percentages
Fluid Bed Dryer TG 200
Conclusion
h) Cleaning and drying of test sieves Test sieves are measuring instruments which should be treated with care before, during and after sieving. By no means should the sample be forced through the sieve mesh during the sieving process. Even a light brushing of the material – particularly through very fine fabric – may lead to changes of the mesh and damage the sieve wire gauze. Near-mesh particles trapped in the sieve mesh are easily removed by turning the sieve upside down and tapping it lightly on a table. For particles which cannot be removed this way a fine hair brush may be used to lightly brush the underside of the sieve mesh.
Coarser fabrics with mesh sizes larger than 500 microns can be effectively cleaned dry or wet with a hand brush with plastic bristles. Sieves with a mesh size below 500 microns should generally be cleaned in an ultrasonic bath. Drying cabinets of various sizes can be used for drying test sieves which should be placed vertically inside the cabinet. It is recommended not to exceed a temperature of 80 °C. With higher temperatures especially the fine metal wire mesh could become warped; as a result, the tension of the fabric inside the sieve frame is reduced which makes the sieve less effi-cient. RETSCH’s Fluid Bed Dryer TG 200 is particularly effective in drying test sieves with a diameter of 200/203 mm. Before cleaning or drying the sieves, the rubber or plastic seal rings have to be removed.
If deviations from the uniformity of the mesh are observed, the sieve is no longer suitable for quality control purposes (DIN ISO 9000 ff) and must be replaced.
Sieve analysis continues to be one of the best proven methods for particle size analysis of bulk materials and is mentioned in various standards. It is easy to perform and provides precise and reproducible results while pre-serving the physical size fractions. Moreover, investment costs are much lower compared to, for example, optical measurement systems. The wide range of different sieving methods is fully covered by RETSCH’s offering which provides a suitable sieve shaker for practically any bulk material. RETSCH sieve shakers guarantee exact and reproducible results in a very short time and fulfill all requirements for test agent monitoring according to DIN EN ISO 9000 ff.
Expert Guide Sieving Would you like to learn more about sieve analysis?
Plan the configuration for your material.
The preparation of a representative test portion comes before separation. Then match the sieve system, loading and motion to the material. Dry and wet procedures also introduce different handling and recovery steps, so their results need a defined comparison rather than an assumption of interchangeability.
| Consideration | Information to provide |
|---|---|
| Measurement range | Fractions required by the method |
| Sample behavior | Cohesion, shape and moisture |
| Procedure | Loading, motion and endpoint |
How should the application examples be used?
The results describe the materials and configurations discussed here. Confirm equipment options, contact materials and operating conditions for your own sample before adopting a method. A demonstrated endpoint does not guarantee the same outcome for a different material.
Discuss material testing with Glen Mills or request further information or a quote.
Explore the equipment discussed
- RETSCH PT 100 Sample Divider
- RETSCH AS 200 Tap Sieve Shaker
- RETSCH AS 200 jet Air Jet Sieving Machine
- RETSCH AS 400 Control Sieve Shaker